


Get in the know about the latest mobile app statistics. How much are consumers downloading apps? How do they behave and what's the yearly revenue? Let's dive in!
Apps are all about the end-user. Get the features, functions, and UX right for your target audience; chances are you'll do just fine.
Understanding what your audience wants, though, is easier said than done. You need stats, you need data, and you need to understand the trends shaping mobile app shopping behaviour.
At JMango360, we're all about killer apps that attract, engage, and convert. Here are just some of the numbers that are shaping our current projects. If you’re planning to build or update an app of your own, these app statistics will help.
Eleven app statistics to inform your e-commerce strategy
01 App downloads have boomed under the pandemic
New downloads of mobile apps passed 2018 billion in 2020. In-app spending hit USD 143 billion. In Q1 this year, in-app spending soared again to reach USD 32 billion — the busiest quarter for in-app shopping on record. Mobile shoppers bought roughly USD 9 billion more in Q1 2021 over Q1 2020.
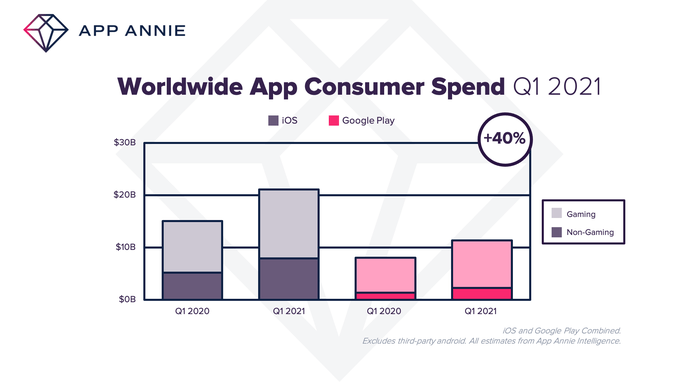
02 Retail apps rule the roost
Gaming apps dominate app downloads across the board, so much so that they can distort the picture. But when you take them out of the equation, shopping apps are seeing the highest growth — 40 per cent more in 2020 than 2019. That’s the highest growth rate by far amongst the top 5 app categories.

03 The average person spends nearly 4 hours a day on their smartphone
We now spend more time on our mobiles than we do in front of the telly. The average American spends 5-6 hours each day on average staring down into a handheld screen. That’s compared to 4 hours spent watching television.

04 Cosmetics brands are leading the way with advanced e-commerce capabilities
Beauty and cosmetics brands are rapidly adding advanced functions like AI and augmented reality to their mobile apps. They make it easier for shoppers to try different shades and colours virtually and see how they might look when applied in real life. The industry is convinced these features are the future, with brands like Sephora and L’Oréal already putting them to work in their apps.

05 Most mobile time is spent using apps
Of all the time spent on mobile devices, some 84 per cent of it is spent in apps. Globally, mobile users spend an average of 4 hours per day using smartphone apps, a jump of 30% from just two years ago. In some markets, the numbers tip higher higher — more than five hours. Between Q1 2019 and Q1 2021, time spent in apps surged by up to 80% in some markets.

06 Google Play rules the app store landscape
In February 2021, the Google Play store released 88.5 thousand mobile apps – a low point for the platform, given that the store averages more than 100,000 new Android apps every month. New Android apps are being released at three times the rate of iOS apps.

07 Wholesale apps win higher AoV
Retailers are using wholesaler apps more often than websites and spending more per transaction. The average order value (AoV) on purchases made with wholesaler apps is 18 per cent higher and contains almost 20 per cent more items than purchases made on wholesalers’ mobile websites.

08 Mobile users want apps, not websites
The gap between mobile apps and mobile sites is getting wider. Adult smartphone users are rapidly reducing the time they spend on mobile phone web browsers and using apps instead. If you want to attract more mobile users, you’ll need an app.

09 One-touch payment options are growing in popularity
Driven by COVID-19, contactless mobile payments will be used by half of all US smartphone users by 2025. In-store mobile payments grew 29% as the pandemic convinced shoppers to trade cash and cards for more convenient (and touchless) mobile payments option at checkout.

10 Voice shopping is here — now
‘Siri, find me a pair of fashion trainers for less than 100 dollars.’ If you haven’t already tried shopping via your smartphone’s virtual assistant, you need to keep up. In 2018, ‘voice shopping’ was already driving USD 2 billion in annual smartphone sales. By 2022 it’s expected to be worth USD 40 billion — a 1,900 per cent jump.

11 Mobile shoppers are going omnichannel
More than 73 per cent of mobile shoppers are omnichannel consumers. That means they shop with apps, social media apps, mobile websites, as well as desktop sites and smart devices. Mobile apps are set to dominate everything in e-commerce, but thinking of your shopping app as the hub on a wheel of buying options — where every spoke supports the whole — will be key to online sales success.

Bonus stat: smartphones are the new PCs
The number of smartphone users globally has crept past six billion, with expected growth of another few hundred million in the coming 4 years. The United States, China, India, and Indonesia have the highest penetration of smartphone users.

The numbers don’t lie
So there you have it — 11 mobile app statistics to help you start moulding your mobile e-commerce approach.
With 60 per cent of web traffic coming from mobile devices and m-commerce sales set to skyrocket this year, it’s safe to say that mobile apps need to be at the heart of your e-commerce channel mix.
Are you thinking about building an app? If you’re further along the process and have specific questions on technologies, platforms, and costs, give us a call.
Follow us:


